We were recently discussing the capabilities and features in a monitoring solution that enable a business observability strategy. But now the most important question is, how do you activate these capabilities to take your IT monitoring to the next level? How do you not only get visibility on every inch of your estate and fix problems before they occur, but also collect important clues on the performance of the business? This post focuses on essential IT Monitoring functionalities that enable business observability. Read it for a glimpse of all the neat ways your IT monitoring solution can be a gateway for business insights. You may also consider Centreon’s business edition and some expert training to get there faster.
AUTOMATION: Put to work a powerful trio
Enabling business observability can only start with a monitoring platform that’s always up to date and that can cover you from cloud, to on premises, to assets at the edge, as your infrastructure is more diverse and dynamic than ever.
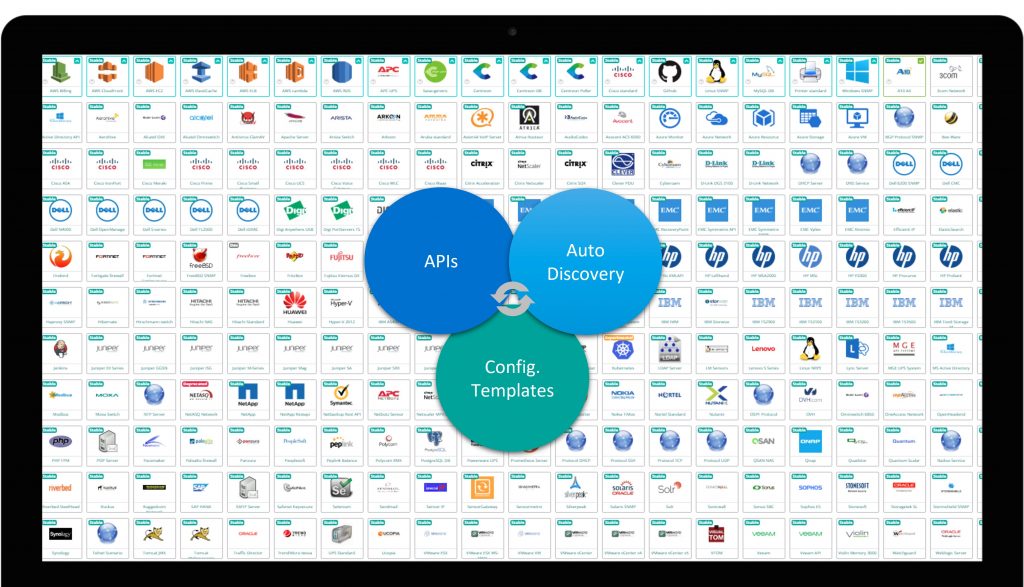
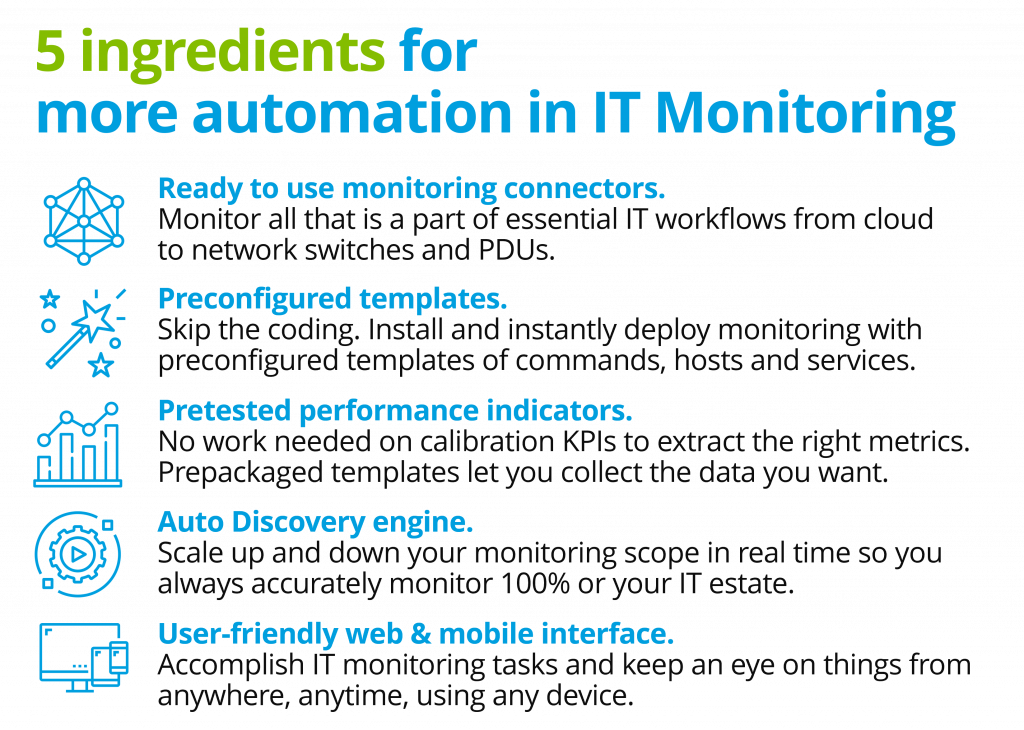
Here, the Auto Discovery engine, the ready-to-monitor configuration templates and Plugin Packs are three allies to fully automate the maintenance of the monitoring platform and to keep it running at its peak.
- The Auto Discovery Engine does just what it sounds like: it automatically discovers day-to-day changes in your IT infrastructure: virtualization clusters, cloud, WIFI access points, SD-Wan endpoints, for example.
- Configuration templates let you skip the time-consuming part: selecting the relevant indicators or threshold to be set from a range of parameters that can be monitored on a given component. Automatically get the right protocol or monitoring method for each infrastructure component, from hardware to applications, select which data should be collected, set the right monitoring thresholds, and choose the proper graph display settings.
- Plugin Packs are ready to use connectors that help you ensure all relevant and qualified data is monitored. No input is required on your part. You can pick connectors from a library that includes:
- Network and security
- Physical or virtualized servers and their operating systems
- Containers and their management systems
- Database management systems
- Storage platforms
- Application middleware solutions
- Job scheduler, backup management platforms and other production tools
- Any other equipment connected to the IT infrastructure and that participates in the enterprise operational processes: cash registers, video surveillance systems, medical equipment, manufacturing tools, etc.
Why automation cannot be missed
If you’re to concentrate on providing added value, a.k.a. the business perspective, you must free yourself from the nitty-gritty details of configuring the IT monitoring perimeter.
Combine these with other automation-friendly capabilities and be on your way to business-aware monitoring.
SERVICE MAPPING: Model critical workflows
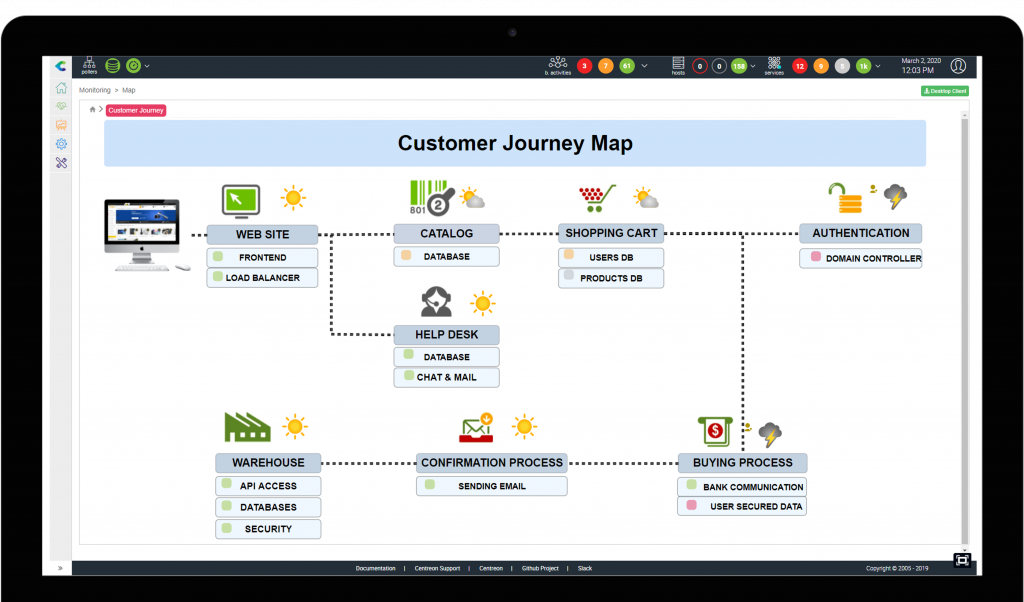
Now that your IT monitoring platform is tightly integrated and always up to date, you’re getting to the core of business-aware monitoring: the modeling of IT services for each business-critical IT workflow. You can add user experience monitoring to the mix to understand even better how IT performance impacts business outcomes.
Service mapping entails grouping all the underlying infrastructure components, identifying their logical relationships, and mapping dependencies to identify causality. This monitoring best practice facilitates root-cause analysis, SLA tracking, as well as IT service, MTTR or MTBF reporting.
Why service mapping is worth it
Service maps allow you to leverage the hidden business information in the assets such as databases or application middleware that you’re already monitoring, such as daily revenues, connected users, or web site analytics. The data can be displayed into your IT service performance cockpits where it will help demonstrate the value of IT to the business, on top of informing decision-making, when for example you need to prioritize interventions. You can see which users are the most impacted. You can also access or share data with your favorite user experience monitoring solutions.
DISPLAY (AND SHARE) METRICS
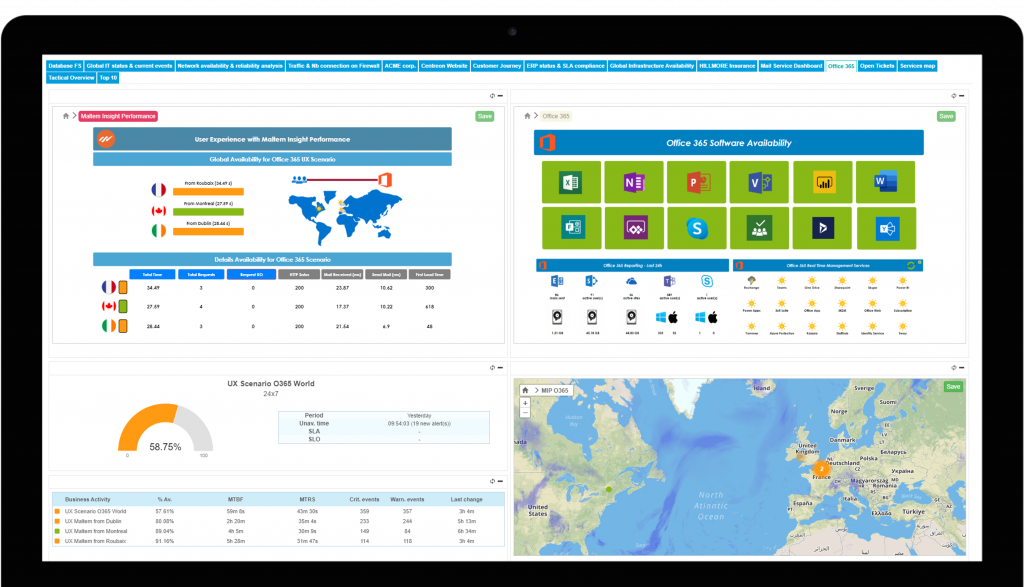
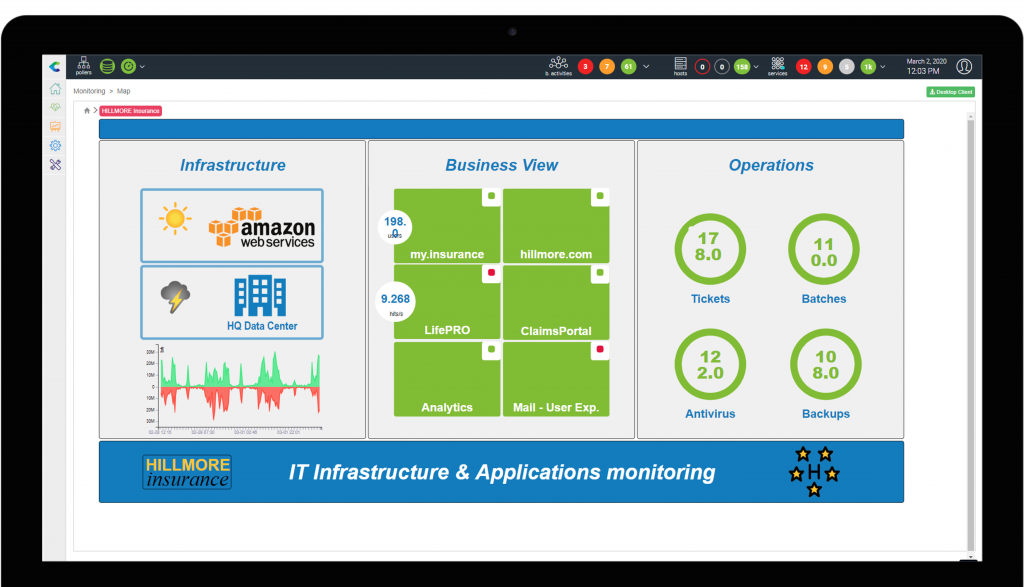
In display, there is the word play. If you’re a Centreon user, you already know this: our solutions offer a comfortable visual experience, thanks to an intuitive, easy-to-use graphical user interface. Basically, we let you play with metrics using a rich object palette: topology, graphs, bar charts, pie charts, gauges, spark lines, etc. You can also add contextual and geographical information.
The goal is for you to get information in a way that makes it easy to be analyzed, displayed, and structured so you’re covered from all angles: geography, network topology, technical components, applications, service or business activity, etc.
Why “playing” with metrics counts
With the Centreon Business Edition graphical dashboards, IT managers and ITOps can become better at managing both internal and external customers because they have exactly the level of real-time information they need right at their fingertips.
How about customizing your views and sharing them?
You can also fully customize your dashboards to aggregate within a single tactical view all the graphs, lists, and tables that you need to efficiently organize and monitor workflows and activities. All you need to do is assemble the desired widgets from our library and you can combine in the same view both real-time values of live a metrics as well as aggregated values over a period. That’s done straight from the web interface which makes it very easy to share rich contextual data with the rest of the team – exactly what you need to facilitate proactive operational maintenance of complex IT infrastructure.
MOVE UP THE VALUE CHAIN WITH ANALYTICS & REPORT
So now that you’ve played with data why not go the extra step of moving this data up to create more business value – through preprogrammed, automatic weekly or monthly updates?
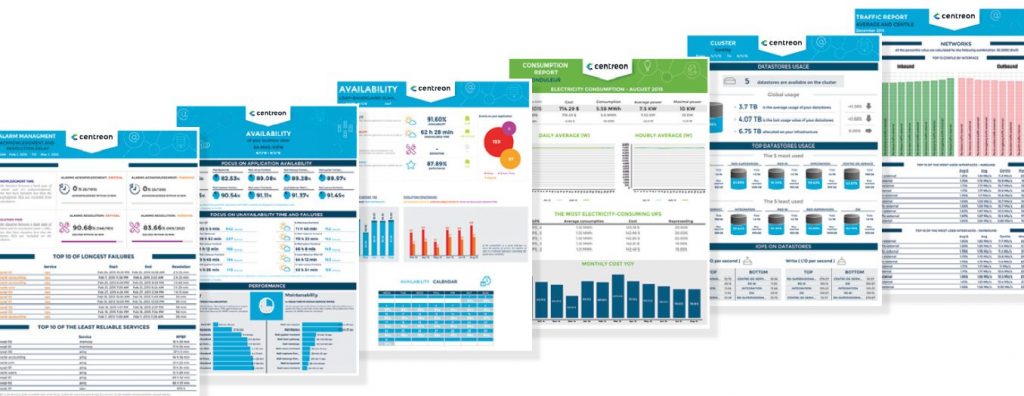
You can use your monitoring data in many ways – here are just some ideas on the type of report that may be useful in your organization. Contact us if you’d like to discuss your own needs for analytics and reports.
- Plan for longer-term IT performance with analytics that informs budget and project planning decisions and see where IT could help optimize key business workflows.
- Report on Service Level Agreements by automatically measuring the availability of IT services modeled using the service mapping feature. Provide additional insights and context with 24/7 and business hours views, or by contrasting actual availability with agreed upon SLAs, pull a list each incident that impacted IT Service, and report on Mean Time to Repair (MTTR) and Mean Time Between Failures (MTBF) KPIs.
- Enhance your contribution to budget meetings with capacity planning reports that highlights past consumption patterns and predict future trends on resources like network bandwidth consumption, storage area network disk usage, or VmWare clusters compute capacity and load balancing.
Why reports matter
Reports not only help teams get a more intimate understanding of business-critical infrastructure, they contribute to higher-level conversations on the value IT brings to business.
Let us help you use your IT monitoring solution to the top of its capacities, including for enabling business observability. Contact us today.
Takeaways
- Correlate your business applications with the infrastructure that support it
- Get and share real-time information using dynamic dashboards
- Plan and manage to align with business objectives using Centreon Business Edition analytics reports
What else can you do?
- Register to our newsletter to get the latest news about Centreon and the lastest Plugin Packs.
- Watch some videos: recorded webinar, tutos and more on our YouTube Channel and subscribe
- Register for training on the Business Edition
- Check some tutorials on our blog
- Join the Centreon user community


