In enterprise monitoring, being able to visualize the performance of entire networks and IT infrastructure has become a given.
Less obvious is the ability to communicate pertinent values: how graphic displays address various monitoring and ITOM objectives?
Centreon MAP is the rich data mapping and visualization tool required of demanding ITOM administrators and DevOps. While its visualization capabilities offer efficient graphic insights, it’s studio application delivers the real gem in mapping correlated data and customizing user-relevant views.
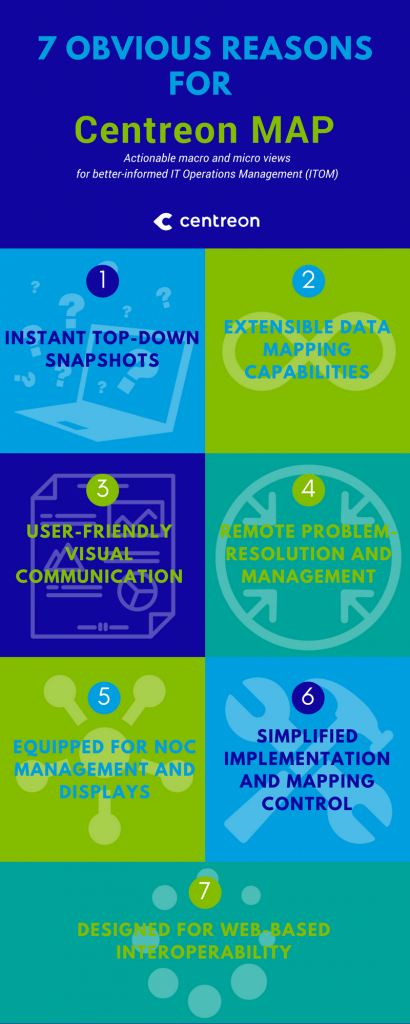
Here are 7 good reasons for Centreon MAP:

- Instant top-down snapshots for different user level insights into real-time operational alerts and performance status using ACL-based authorization.
- Remote problem-resolution and management for multi-site operations with controls to troubleshoot from a distance as well as launch applications hosted on user clients.
- User-friendly visual communication with a multitude of graphic indicator representations, e.g. topology, graphs, bar charts, pie charts, gauges, sparklines, tables, etc., leveraging a rich object palette.
- Extensive data mapping capabilities to create custom real-time views that display analyzed information in drill-down tree structures (set of screens) by geography, network topology, technical component, application, service or business activity, etc.
- Equipped for NOC management and displays, including the ability to generate multiple views on a single control monitor, and with view rotations of overall infrastructure, interconnections and applications.
- Simplified implementation and mapping control as a result of systematic data synchronization with Centreon databases, facilitating updates based on parent-child relationships, object groups or dependencies each time a monitored resource is added, modified or deleted.
- Designed for web-based interoperability with built-in web service (REST, SOAP) to interconnect with other applications and devices as needed.
With Centreon MAP, ITOM and NOC teams are not only better informed but are also able to inform better. Educating management about IT operations becomes a proactive and smart exercise as they are empowered to “show” and “act” on improving service availability and performance in IT.
Learn more
See our tutorial (including a short video!): How to create my first views with Centreon MAP


